|
作为支持.net的强大的开源图表控件ZedGraph,最新版本是 New Update as of 28-Nov-2007 Version 5.1.4 + 4.6.4 官方主页:http:/// SOURCEFORG主页:http://zedgraph./ 5.x的是支持.net2.0的,4.x的是支持.net1.1的,由于个人原因,这里使用的版本为5.1.1的,方法大同小异。
由于是开源,很多代码可以从sample中找到,但是例子中没有LineChart的添加数值的方法。通过参考例子中给BarChart添加数值的方法,这里给出一个相对可行的解决方案。
ZedGraph中所有的元素都是以GDI+的技术画上去的,实际上我们要做的事情就是建立几个TextObject添加到图表中去,在这之前还要找到每个点所在的位置 。 实际做法也很简单,在 masterPane.AxisChange(g); 后面加一些代码:
 int ord = 0; foreach (CurveItem mycurve in myPane.CurveList) int ord = 0; foreach (CurveItem mycurve in myPane.CurveList)   { { LineItem line = curve as LineItem; if (line != null) LineItem line = curve as LineItem; if (line != null)  { IPointList points = mycurve.Points; for (int i = 0; i < points.Count; i++) { double xVal = points[i].X; double yVal = points[i].Y; string lab = yVal.ToString("0.00") + "%"; TextObj text = new TextObj(lab, (float)xVal , (float)yVal*1.01); text.Location.CoordinateFrame = CoordType.AxisXYScale; text.FontSpec.Size = 10; text.Location.AlignH = AlignH.Center ; text.Location.AlignV = AlignV.Bottom; text.FontSpec.Border.IsVisible = false; text.FontSpec.Angle = 0; text.FontSpec.Fill.IsVisible = false; myPane.GraphObjList.Add(text); } } ord++; } { IPointList points = mycurve.Points; for (int i = 0; i < points.Count; i++) { double xVal = points[i].X; double yVal = points[i].Y; string lab = yVal.ToString("0.00") + "%"; TextObj text = new TextObj(lab, (float)xVal , (float)yVal*1.01); text.Location.CoordinateFrame = CoordType.AxisXYScale; text.FontSpec.Size = 10; text.Location.AlignH = AlignH.Center ; text.Location.AlignV = AlignV.Bottom; text.FontSpec.Border.IsVisible = false; text.FontSpec.Angle = 0; text.FontSpec.Fill.IsVisible = false; myPane.GraphObjList.Add(text); } } ord++; } 注意:
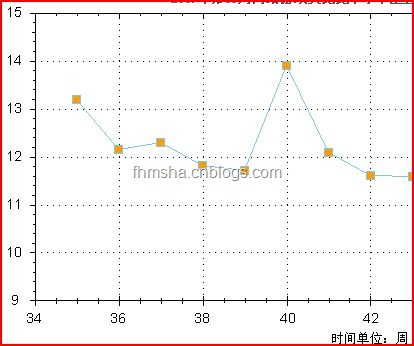
最后的效果图: 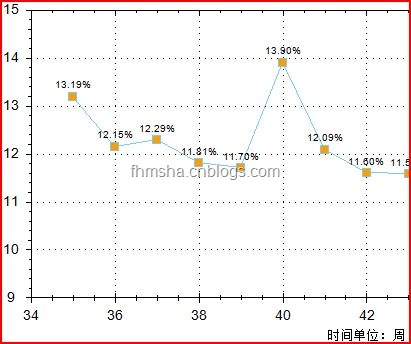 |
|
|